Integrating diversity and inclusion is a key ingredient for our organisational success - it helps DPMC and NEMA improve our services to the Government and people of New Zealand, and to attract and retain talented employees. Attached is the DPMC Gender Pay Agency Action Plan for 2021/22.
Formats
DPMC 2020/21 Gender Pay Agency Action Plan#
Integrating diversity and inclusion is a key ingredient for our organisational success - it helps DPMC and NEMA improve our services to the Government and people of New Zealand, and to attract and retain talented employees.
DPMC/NEMA Data Summary as at 1 Jan 2020#
GPG: Mean - 12.79% Median - 7.33%
DPMC Demographics
Structure of DPMC by grade:
By remuneration review
NZIER analysis identified no statistically different application of the performance or remuneration results by gender, 3rd year in a row.
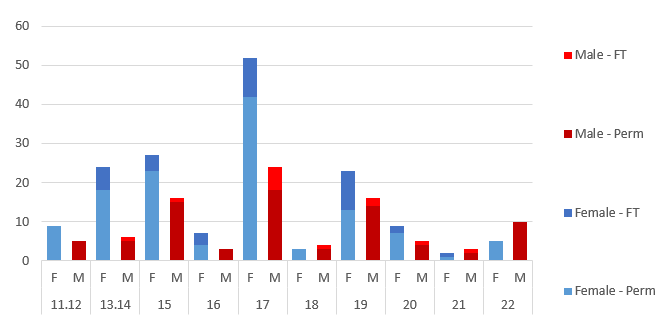
By employee type
| Employment Type | MEAN Total REM | ||
|---|---|---|---|
| Male | Female | % Gap | |
| Permanent | $129,781 | $113,341 | 12.67 |
| Fixed Term | $142,649 | $120,575 | 15.47 |
| Total | $131,658 | $114,815 | 12.79 |
Men in fixed-term roles are on average in higher grades and paid more than women.
By same/similar roles
DPMC met Equal Pay milestone in 2019 (where sufficient roles to compare).
| Grade | Role cluster | #female | #male | #n | GPG |
|---|---|---|---|---|---|
| 13.14 | Support | 17 | 1 | 0 | -3.75% |
| 15 | Analyst/advisor | 12 | 15 | 1 | -6.97% |
| 17 | Senior analyst/advisor | 49 | 22 | 0 | -0.93% |
| 19 | Principal advisor | 15 | 14 | 0 | -6.80% |
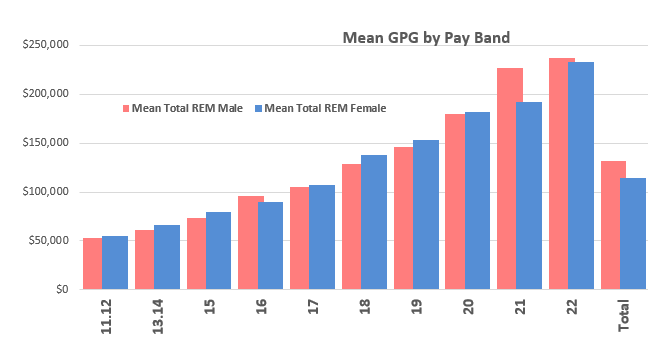
By Pay Band
Of the 10 pay bands below T2 roles 7 have a GPG positive to women.
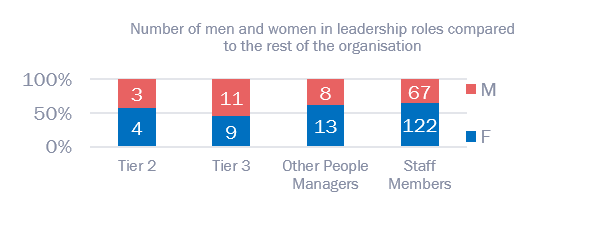
Gender balanced leadership
Women occupied 58% of all people manager roles (28 of 49) and 48% of T2 and T3.
Recruitment, progression and turnover#
Recruitment - More women on average apply to roles than men. Overall more women short-listed, interviewed, offered roles and appointed than men – except roles grade 20 and above, in which less women were appointed in 2019, 1 woman to 7 men.
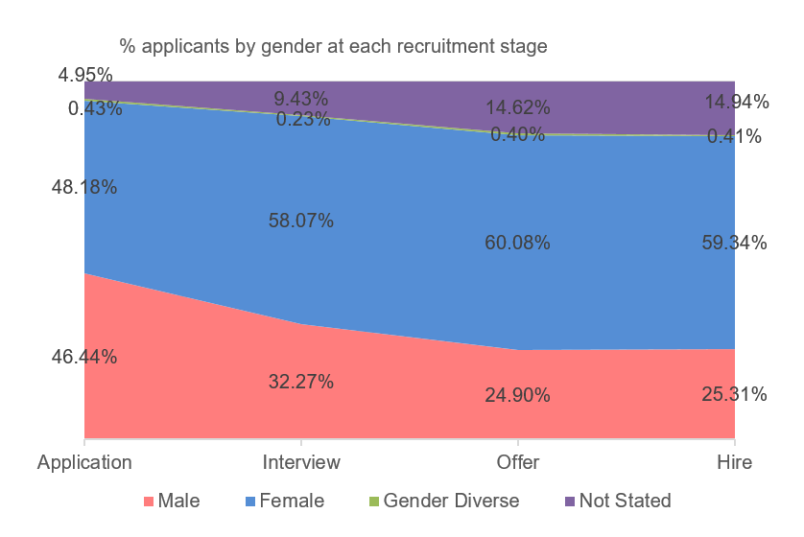
- More male applicants in higher grades and for NSG roles
- % of female applicants into leadership roles drops to 36% and in NSG to 24% (55 of 233)
- % of female applicants hired across leadership roles is 71% (23 of 32)
Promotions from graduate analyst to analyst and from analyst to senior appear proportionate with those ready to be considered. Evidence show that staff (M and F) are not being retained through the analyst/advisor pipeline.
Higher representation of women identified as high potentials.
Women are offered development opportunities at a no less rate than men.
More high performing women leave DPMC (people leaders and non-people leaders) than their high performing male counterparts – exit information indicate go to promotion opportunities or career change. As a small department there are less senior role opportunities.
No internal appointees to the T2 and T3 roles (M/F) in last two years. Only one woman to seven men appointed in 2019 in grade 20 and above.
Staff engagement
There is no statistical difference in our engagement score (Kōrero Mai) - 66% for women compared to 64% for men.
Part-time permanent staff have a lower engagement score (54%) and were less ‘happy’ working in DPMC in both the 2018 and 2019. This group makes up 10% of staff and is predominantly female (31 staff, 25 women, 6 men).
Turnover - In 2019 81 staff exited DPMC, 57 (70%) were women. The proportion of women in DPMC is 63%. 72% of the leavers (41 of 57) had less than 3 years’ service, for the equivalent male cohort this was 67% (16 of 24).
Impact of recruitment and turnover – 1 July - 31 December 2019
| Starter # | Ave rem | Exit # | Ave Rem | |
|---|---|---|---|---|
| Women | 21 | $107,000 | 31 | $103,000 |
| Men | 12 | $163,000 | 8 | $108,000 |
| GPG 30 June 2019 Mean | 7.61 | |||
| GPG 31 Dec 2019 Mean | 12.79 | |||
What does our data tell us?#
- DPMC’s pay gap is driven by a structural issue. Under representation of women in some higher pay grades drives the unadjusted pay gap.
- DPMC is a small agency where changes in staffing can cause data volatility within grades and across the organisation. For example see earlier table on impact of starters and exits between July and December 2019 which shifted GPG up from 7.61% to 12.79%.
- Staff progression through the leadership pipeline or the analyst/advisor pipelines may be less effective than expected indicating that we may be able to improve how mechanisms designed to support this operate (e.g. succession planning, career pathways and promotion/ progression). Additionally the data may be impacted by the fixed term nature of many roles and retention.
- National Security Group (NSG) does not look to be attracting female applicants as effectively as the rest of DPMC.
- The impact of fixed term staff (20%) on the data is not well understood.
- Part-time staff have lower engagement scores, we need to understand this.
Our focus for 2020 and 2021:#
- Establish career pathways with promotion/progression for analyst/advisor pipeline to support movement through the pipeline and retention of women in grade 15 (NSG and NEMA).
- Develop and implement succession planning to address retention of high potential women.
- Work with NSG to understand the recruitment data and develop plan to attract more diverse applicants in recruitment process.
- Engage with part-time staff to understand what would improve the workplace for this group.
- Implement GPG comparator tool and GPG recruitment ‘checkpoints’ into SnapHire for managers to consider gender during recruitment and on appointment.
- Further work to understand:
- Retention data
- Impact of fixed term staff on gender data
- Continue:
- Growing DPMC’s inclusive culture
- Implementation of flexible work by default
Action taken in 2019 against our plan#
Our GPG plan is focused on what is required for DPMC and NEMA to close their gender pay gaps, it also aligns with the broader requirements for all agencies set out by SSC.
Gender balanced leadership#
- DPMC committed to a principle of a gender balance in senior leadership (T1-3) roles of 40% minimum of female and male, with the remaining 20% flexible. Achieved.
- Commenced a New People Leader Development Programme to build a balanced pipeline of leaders.
Equal Pay#
- In 2019 DPMC met the milestone for Equal Pay. An individual analysis across same or similar roles was completed, with DPMC comfortable that differences were explainable. This analysis was in addition to the review undertaken by managers and the moderation by ELT as part of the remuneration review and the statistical analysis undertaken by NZIER.
- A significant part of meeting the Equal Pay Milestone was having no gender pay gaps within same or similar roles (where there are enough roles to compare) for the support role: G13.14; analyst/ advisor: G15; senior analyst/advisor: G17; and principal analyst G19.
- The NZIER review across all grades (a proxy for same or similar) identified some grades for further review where there were outliers – these were considered and were explainable by length of service, performance, or the skills sought for a fixed term role.
- Completed and implemented the review of Government House remuneration ensuring there were no bias in the roles.
Flexible work by default#
- Joined the SSC pilot group for flex by default.
- Progressed discussions on working flexibly, developed a new draft policy and guidelines. Covid-19 lockdown has shown us we can do it. DPMC will now incorporate what we have learned to support managers and staff operate in the new ways of working.
There is no bias or discrimination in remuneration systems and HR practices#
- Inserted step into the remuneration review so managers could see the impact on gender pay of proposed increase.
- Used a split matrix[1] to shift low paid workforce – DPMC has a high number of women in lower grades.
- Engaged NZIER to assess the GPG within roles as well as across the Department after the remuneration review (3rd consecutive year).
- Coming before end of June – a GPG comparator tool so managers can consider comparison when making appointments.
[1] Our split matrix approach is designed to enable DPMC to achieve faster movement for those in the lower grades. By having higher percentage movement for the lower grades (compared to less movement in the higher grades) DPMC can to move those staff in the lower grades, who are meeting DPMC expectations, more quickly through the range, thus reducing the gap between the low and higher waged staff.
Ethnicity Data #
DPMC has not been able to analyse ethnicity data as the pool is too small and the recording of data is imperfect. From 258 staff, 24 identified with an ethnicity other than European and 39 did not disclose. DPMC is currently working to improve recording the recording of the ethnicity data.
Other#
- Values and behaviours and the development of a more inclusive culture, linking performance with agreed Performer Expectations.
- Implemented a Domestic Violence Support Policy and processes.
- Quality conversations - all managers and staff will be offered development in the 2019 Quality Conversations programme.
- Review of promotion rounds – not done yet – now 2020.
- Work with permanent part-time staff to understand their perspective – not done yet – now 2020.